From layers and specificity to nesting, from HD color to (scroll) animations. If there is one thing that makes me keep using Chrome as my default browser while developing, it has to be the DevTools and the information we can find about them. As we’re slowly entering the last part of the year, I thought a cool roundup of new CSS debugging tools would be a great article. Let’s dive into it.
Viewing CSS layers
I’m actually starting off with a feature that was added before 2023, but one that I’ve only been using recently as I was working on a modern CSS “bootstrap file”.
When working with multiple layers, especially across multiple files, it is possible to get a bit lost. Thankfully, DevTools has got our back as we can now see in which layer a selector was specified by looking right above it in our style panel:
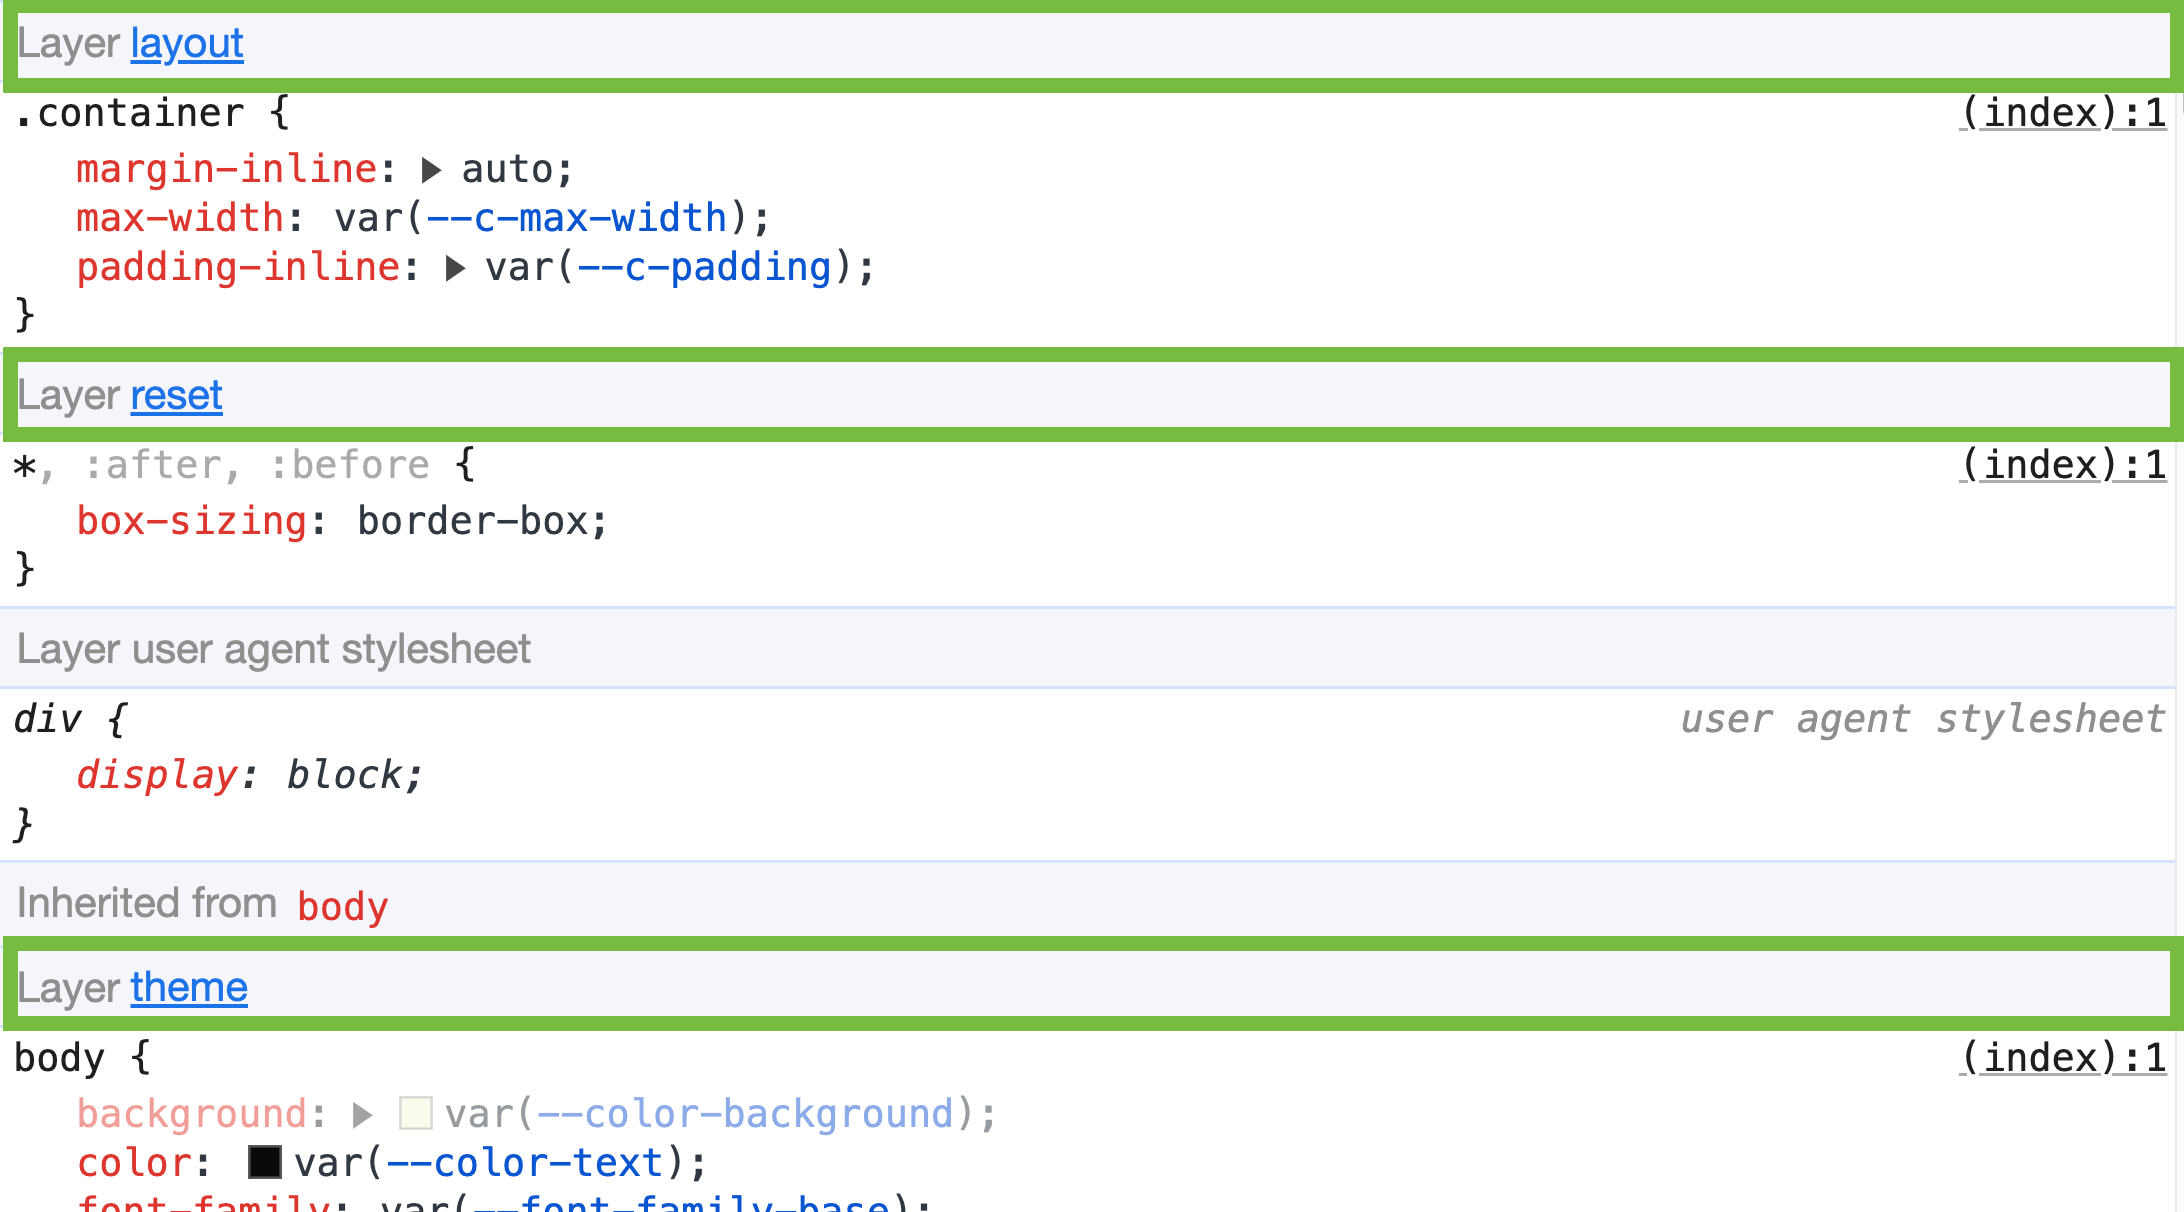
It does get a bit better than this though. If we’d like to see a great overview of our layers, we can just click on the layer itself to view where this layer is added in our cascade. This is especially handy when working with a lot of nested layers, to keep our sanity in check:
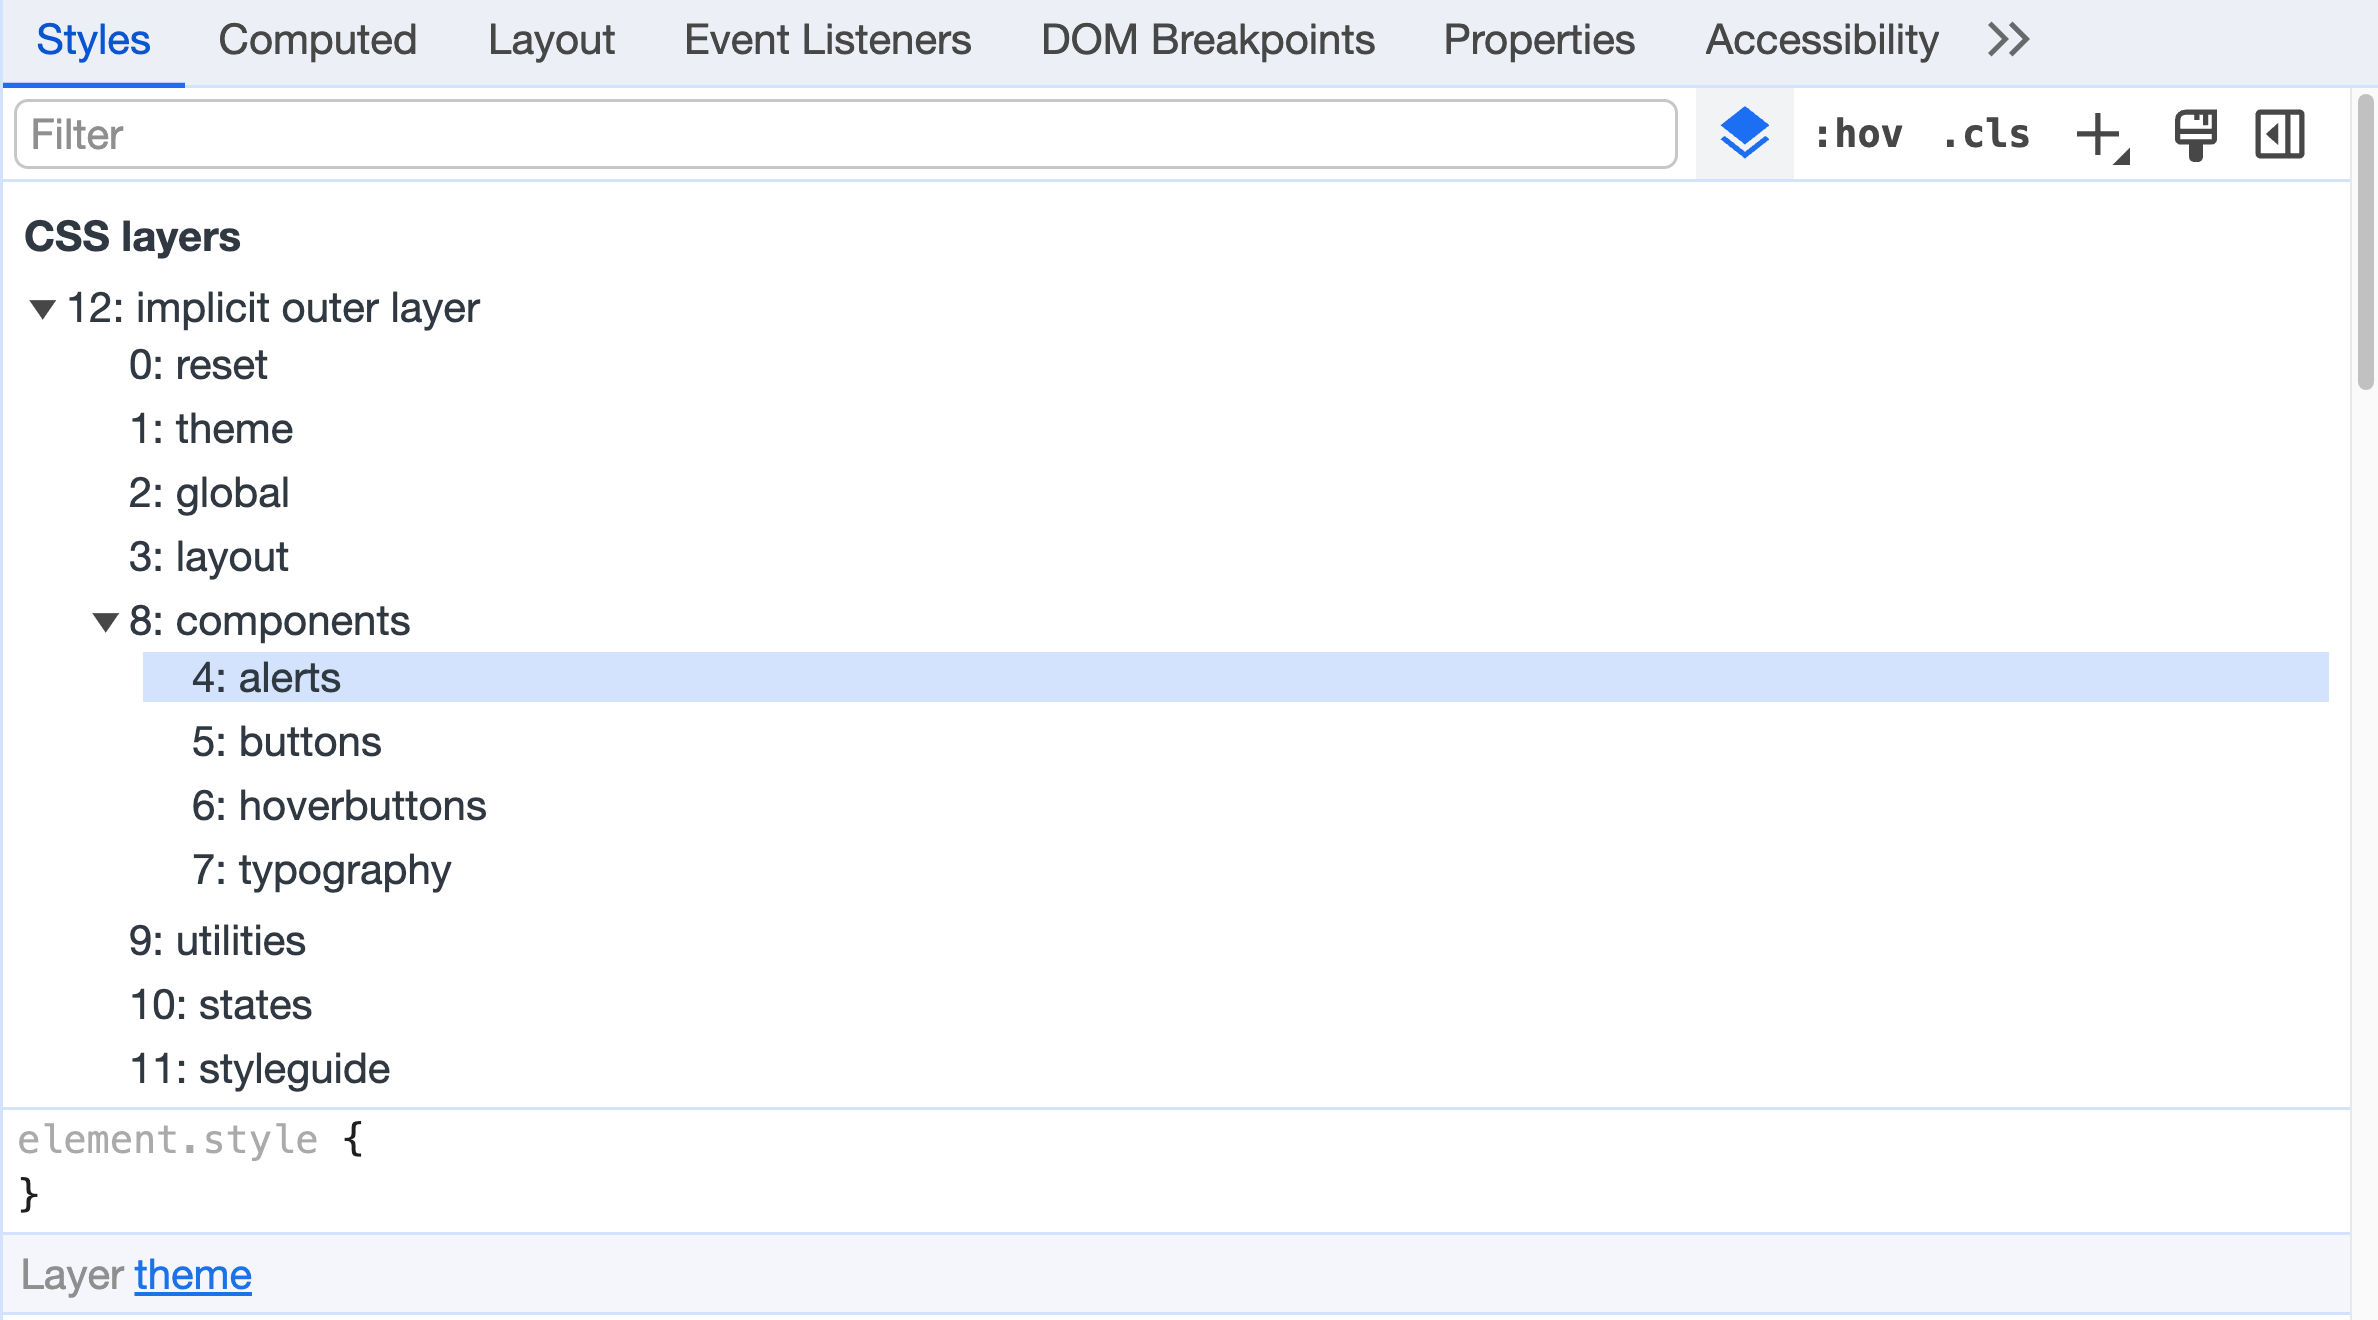
If we just want to view the layer tree, we can also click this little Icon in the style panel
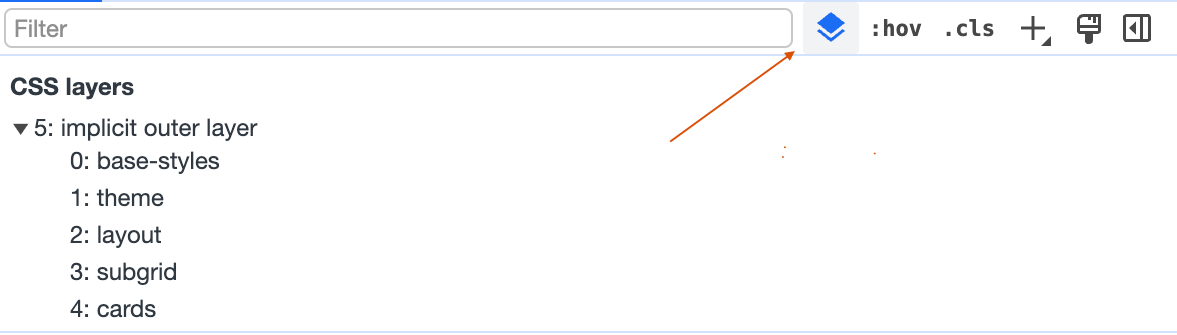
At first sight, some people might think this really isn’t something with a big use case, but if we work on multiple projects in multiple layers and start nesting these layers as well, it can really help us out:
@layer theme {
    :root {
        --font-family-heading: Georgia, times, serif;
    }
}

@layer components.typography {
    h1,
    .h1 {
        font-family: var(--font-family-heading);
    }
}
Layers are starting to get used a lot more often, so it’s great to have these tools.
Checking selector specificity
This little update might’ve gone unnoticed for some, but it’s one of those little additions that can really help while debugging or just building our design system.
When we hover over a selector, we now get to see the specificity:
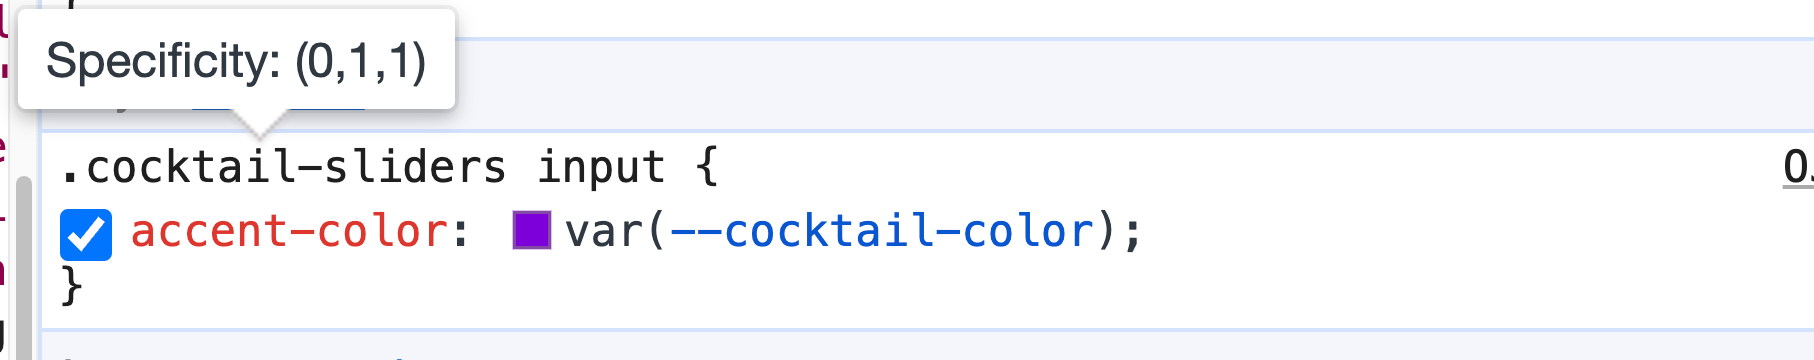
No more guessing or using external tools for this, we can just view it in our devtools. I love how sometimes little additions can have a big impact, this is one of those.
No idea what these three digits are about?
You can read up on it on MDN, but if you’d rather have someone explain it to you, you can always watch this part of a talk by Bram.us.
Clear nesting support
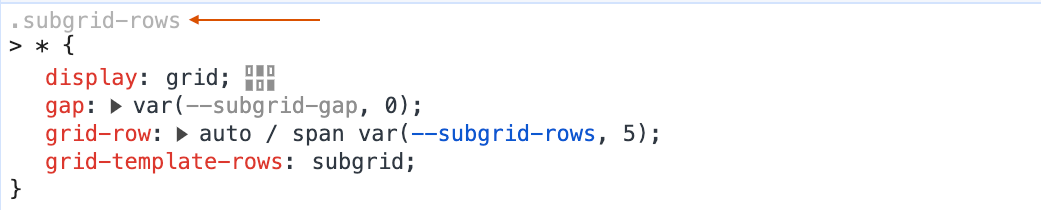
This year, we also got a bit of extra tooling when it comes to nesting. It’s just another one of those quality of life improvements that shows the parent selector grayed out in the styles panel. Once again, a little visual update, that goes a long way!
HD color formats
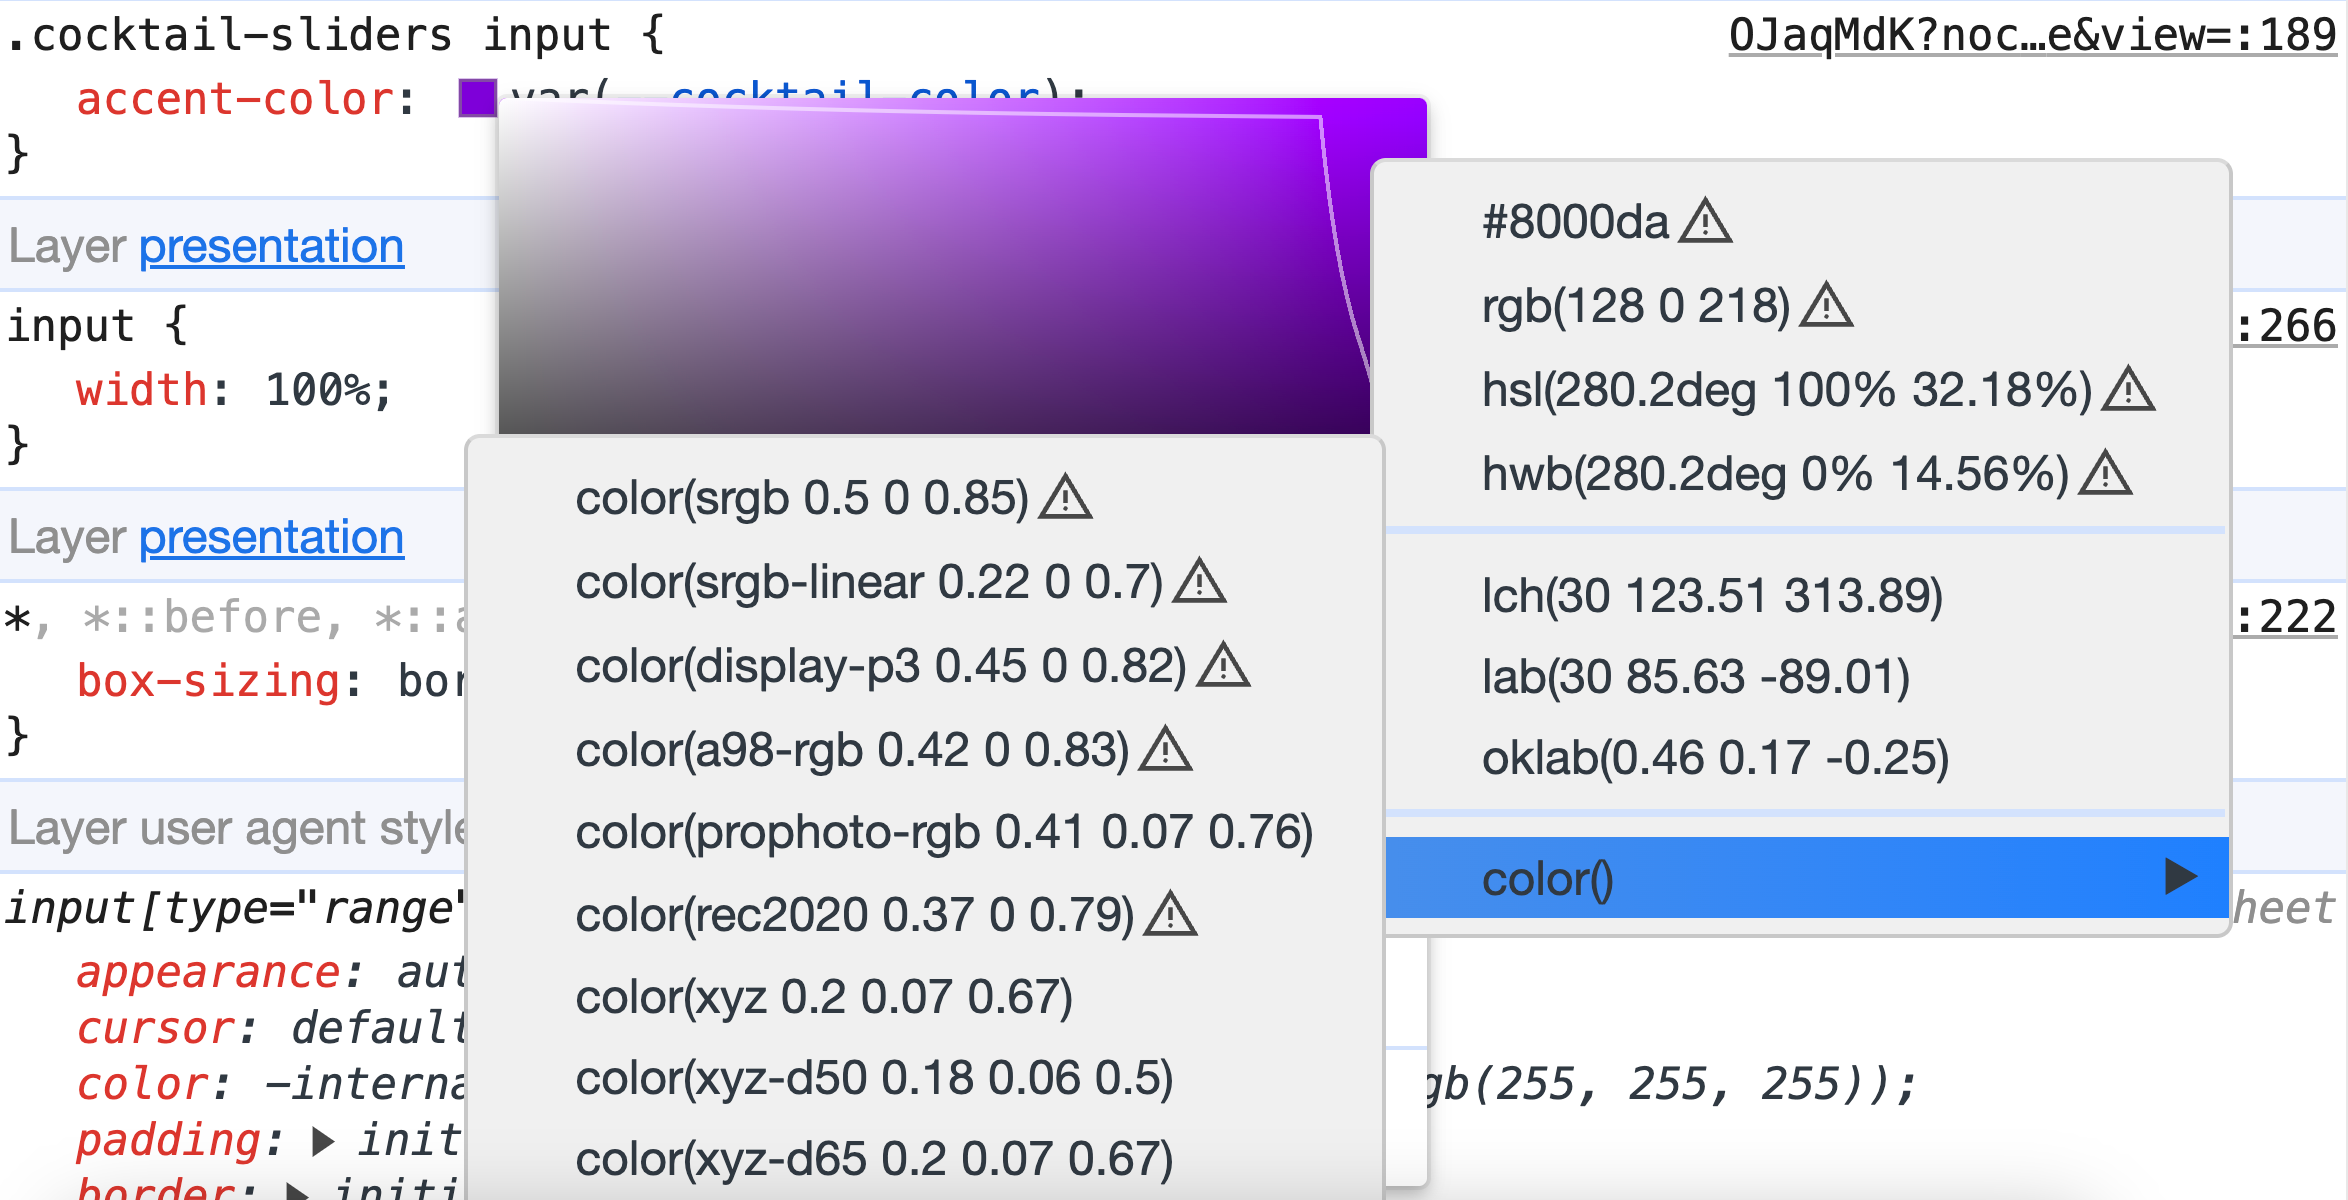
We have all these new color spaces in CSS and they are so much fun to play around with. We might need to add fallbacks for browsers that don’t support it yet when using them. However - in DevTools - we can easily see when we leave the sRGB color space when opening the color panel in the styles panel (notice the area marked with a red border).
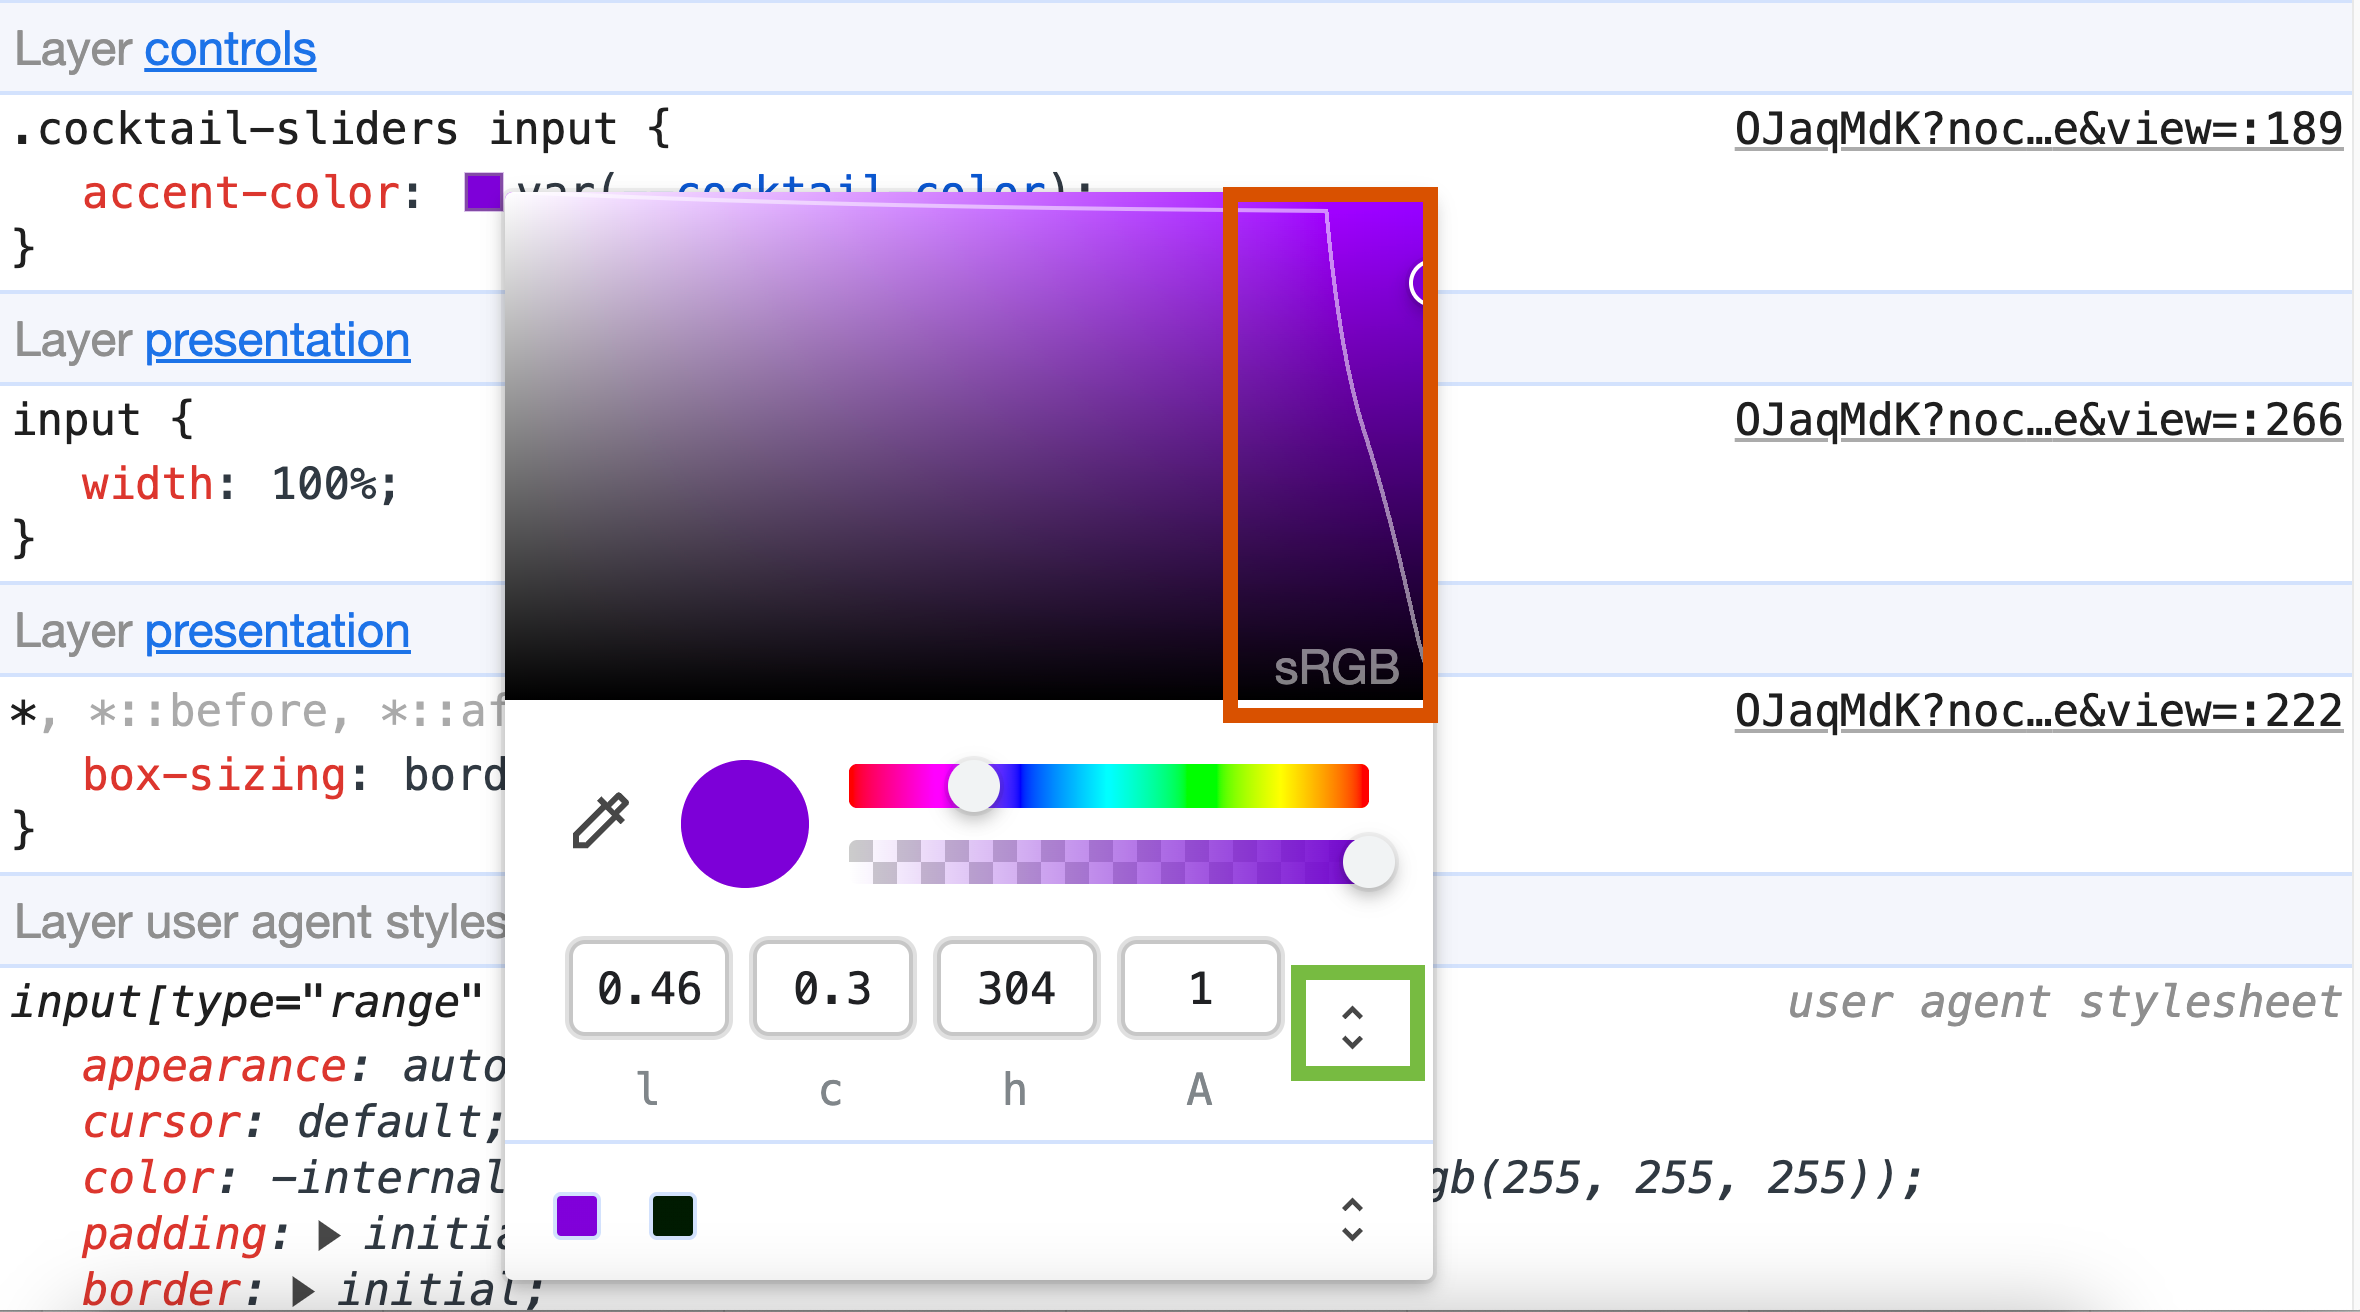
In this example, I was using an oklch. There is a simple way to change the current color space we’re working in by clicking the area marked in green on the screenshot above. I’m not sure if this is something we’ll use a lot, unless designing straight in the browser. But it did help me out creating some of those demo’s.
The demo i was referring to is the following one:
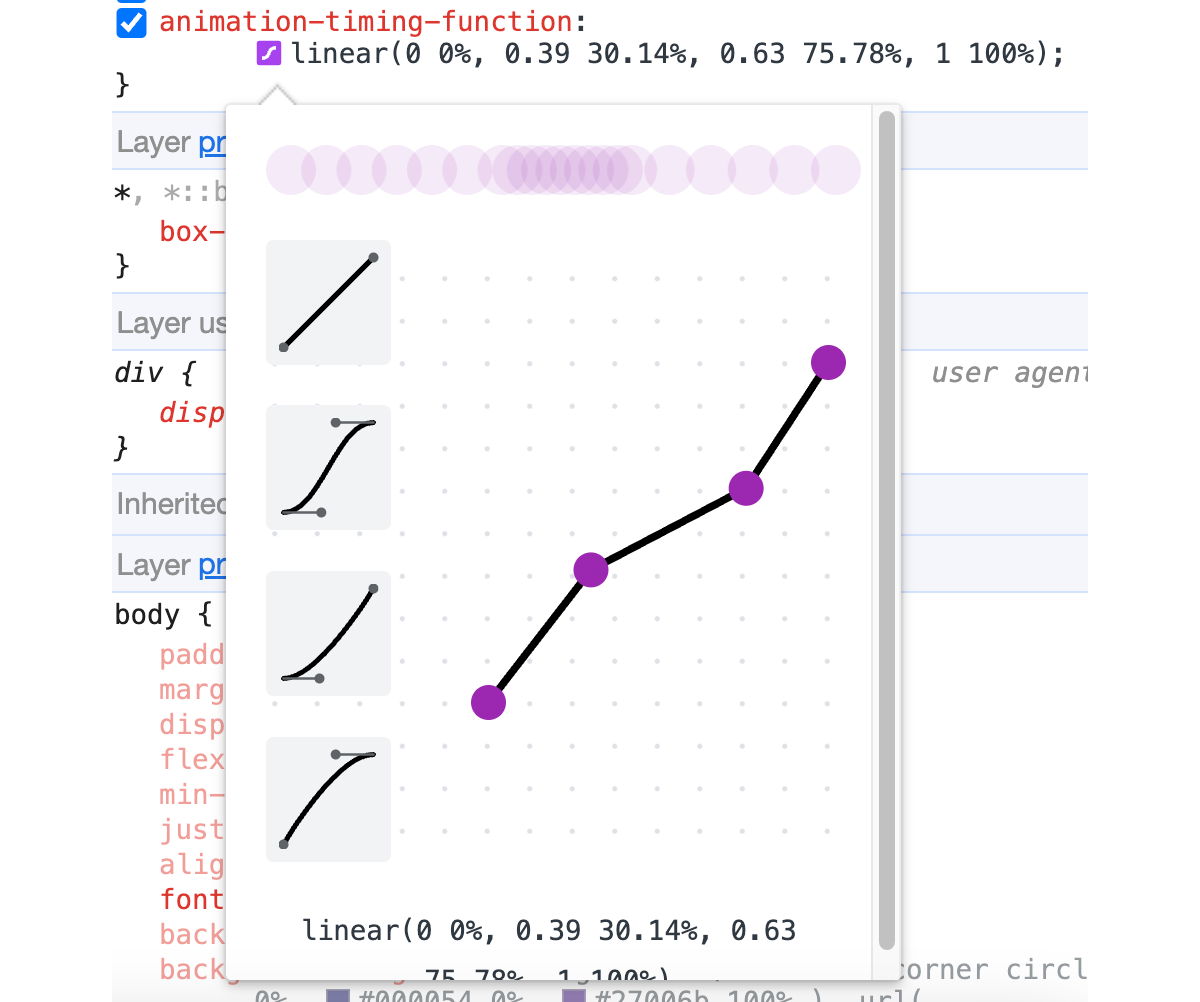
Linear timing support in the easing editor
When using the animation-timing-function: linear(); function, we can now easily update the curves by clicking on it and dragging around in the curve. Just left click to add an extra point and double click to remove it, there are also some presets to be found on the left.
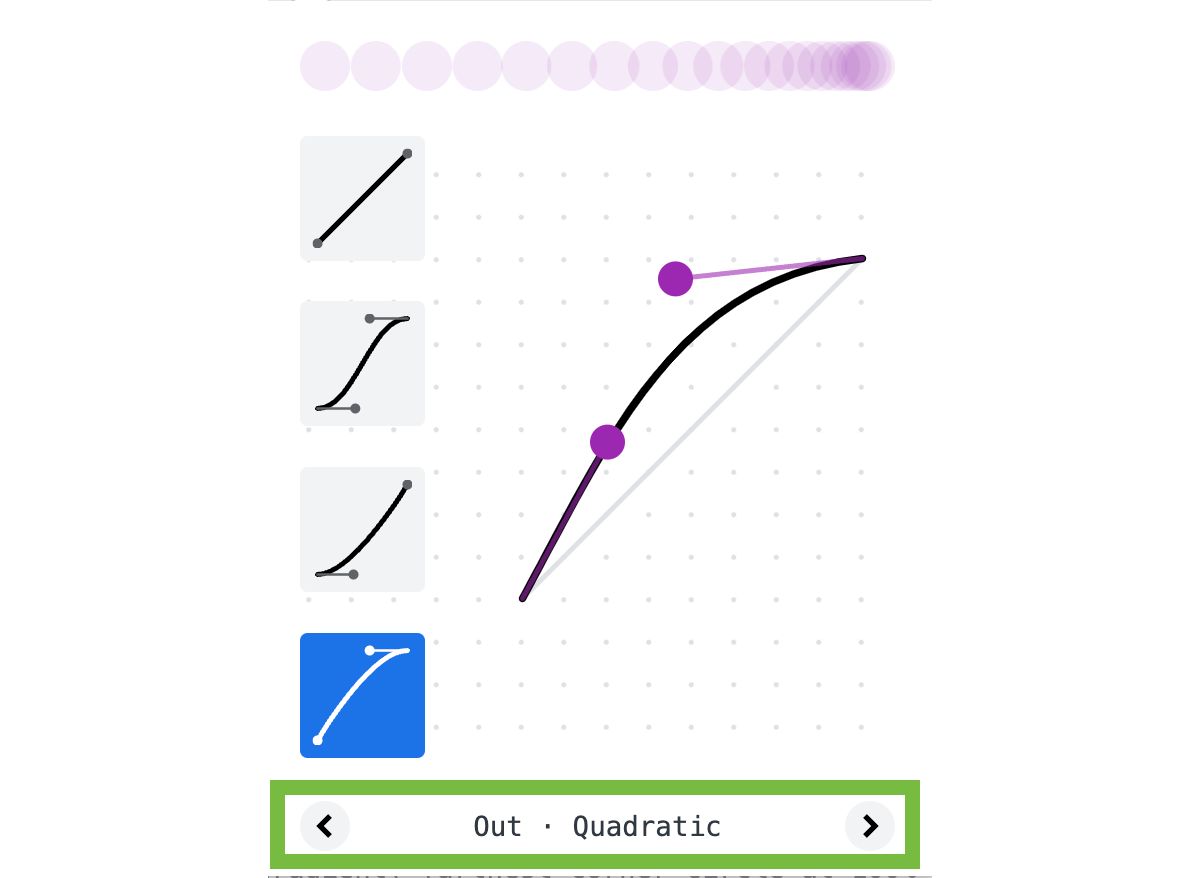
🔥 Extra hot tip: Did you know that by clicking the arrows at the bottom of this little popover you can get a lot more presets created by cubic-bezier()? Pretty cool for tweaking those animations and want to find something “just right”.
Transparency preference in the rendering tab
The rendering tab is probably one of the tabs I use the most for that final accessibility check and test for reduced animations, vision deficiencies, etc. I talked the rendering panel in a previous article and used the contrast emulations for a little article on Smashing Magazine. It has something new though.
We can now check if a user has toggled a reduced transparency preference.
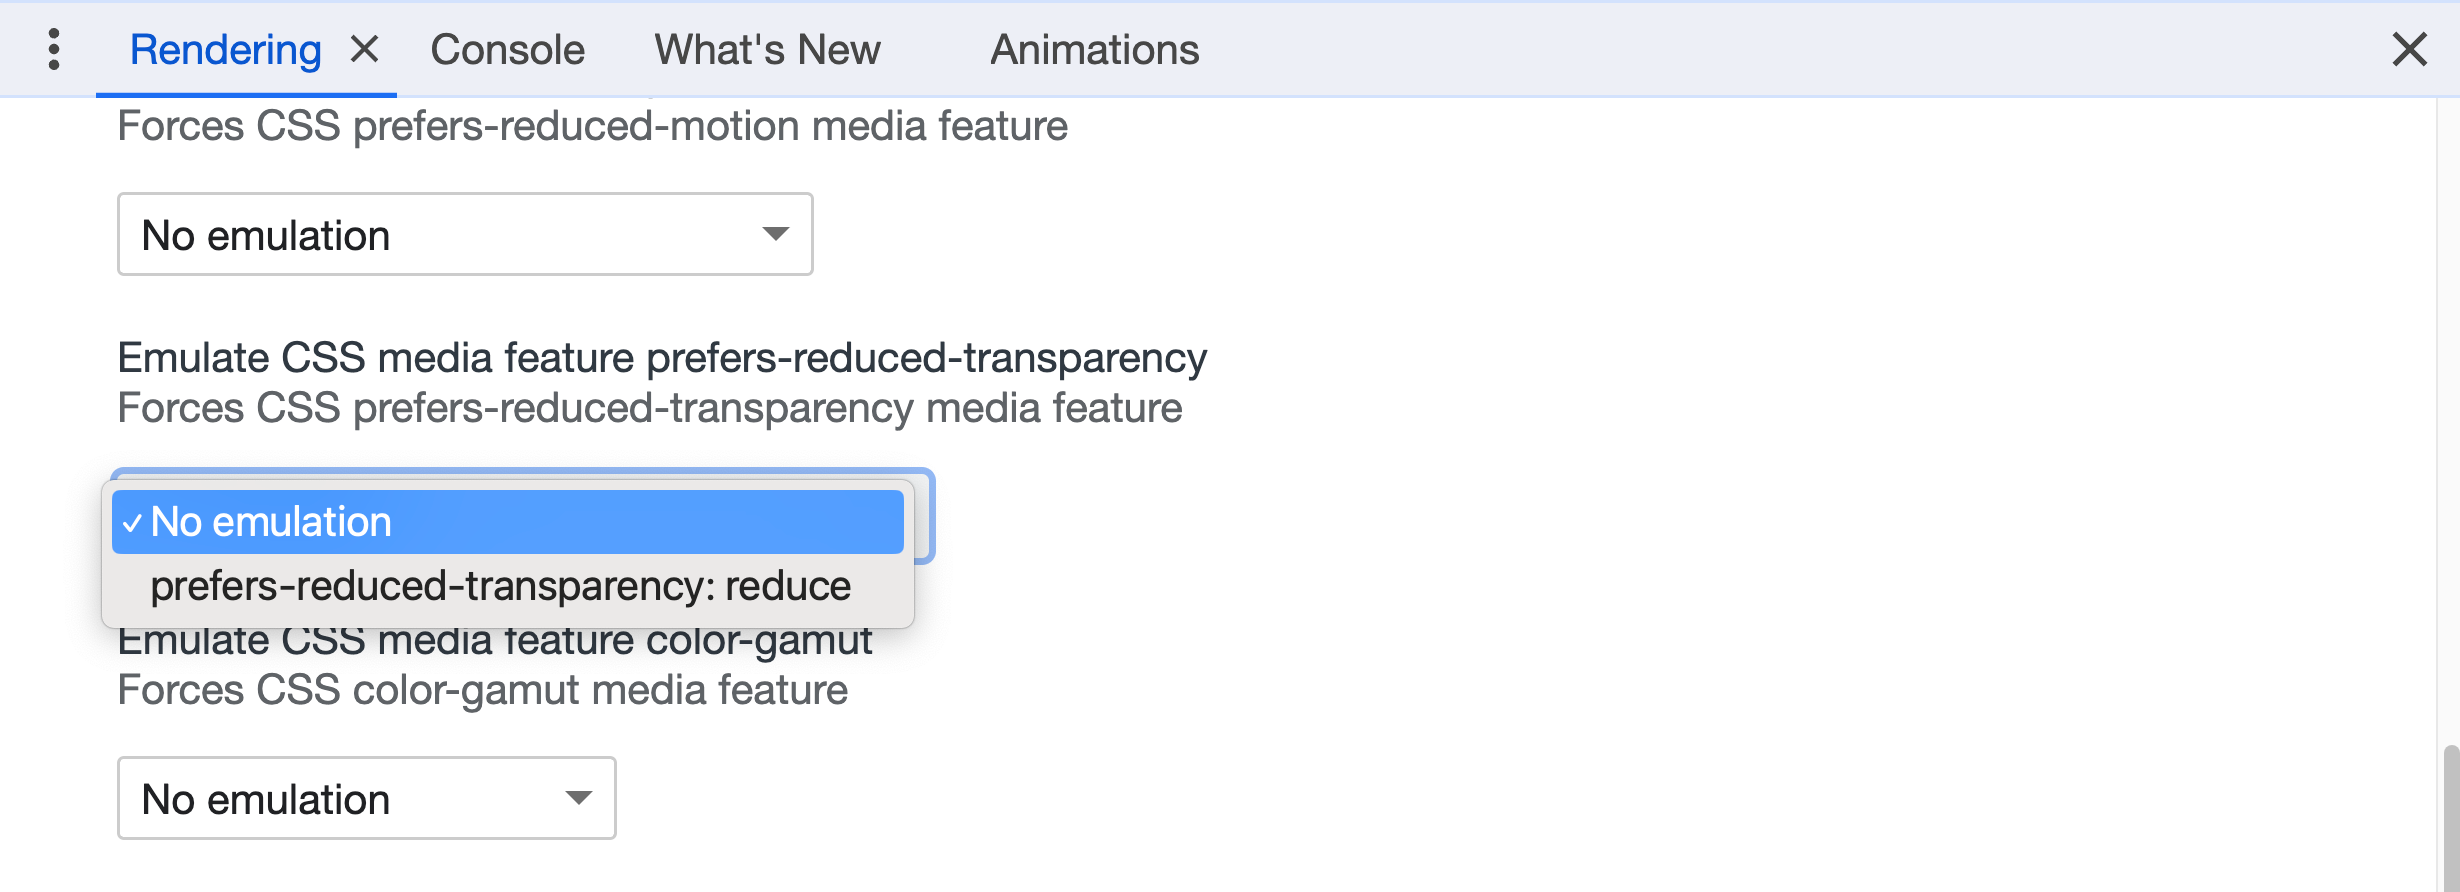
This goes hand in hand with a new media feature query (currently only in Chrome and Edge):
.transparent {
    opacity: 0.5;
}

@media (prefers-reduced-transparency) {
    .transparent {
        opacity: 0.85;
    }
}
Why reduced transparency matters
Various operating systems provide a preference for reducing transparency, and user agents are likely to rely on these system settings. For now, this feature query is only supported in Chrome and Edge, but I’m sure other browsers will follow. Especially as this is a setting that can be set on both iOS and macOS as well.
I think the ability to make the web platform an extension of user systems in their operating system is a great thing. Especially for applications running on the web.
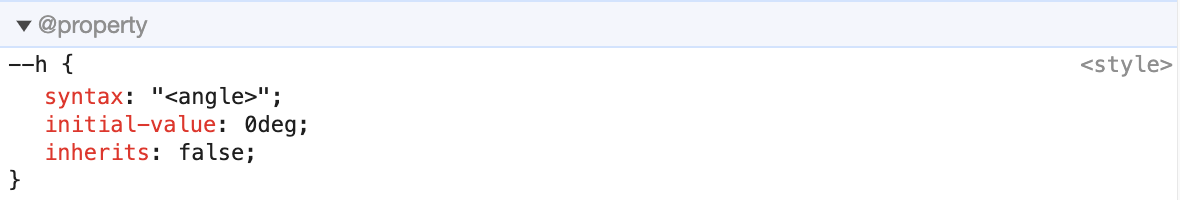
Editing @property defined custom properties
In case you missed it, we are finally getting full browser support for @property very soon with Firefox planning to release it in the next version. In Chrome DevTools we now have the ability to do some debugging, the @property declarations are grouped together and we can change the values in the style panel. This will come in handy and also reminds me that I really want to write about @property sometime.
Bonus: Scroll Driven Animations debugging
I’m a big fan of the new scroll driven animations spec, I even updated my homepage with it. But now, there is a way to easily debug it. This is a bonus as it is an extension that we can add to our devtools. The extension can be found at the chrome web store. Add the SDA debug tool to Chrome here.
When installed we get an extra panel next to the styles, layout, accessibility panels. This will give us a little minimap when using scroll driven animations:
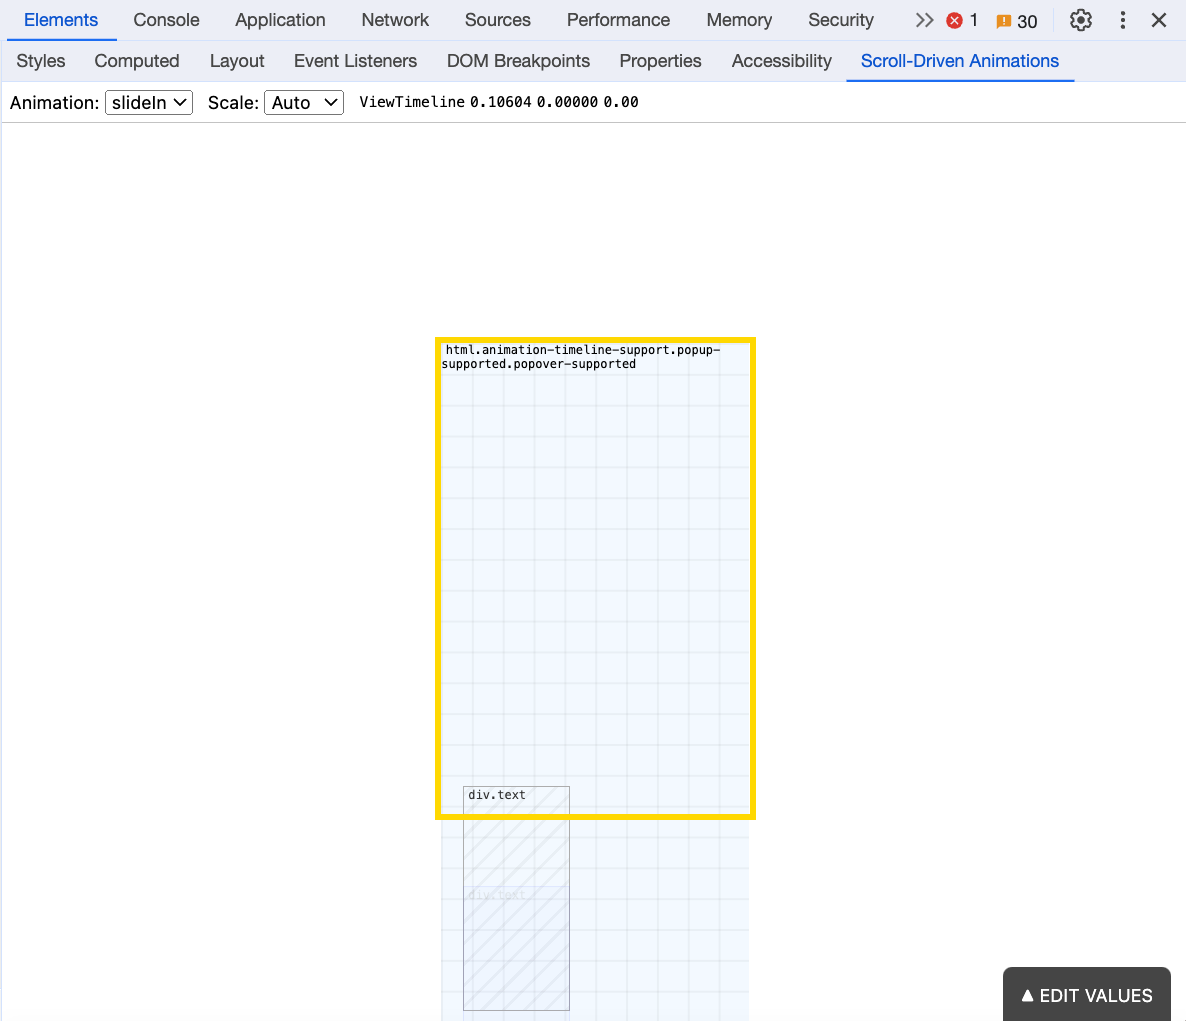
This is so cool! Especially because I still haven’t completely wrapped my head around the terminology yet (eg: cover, contain, crossing, etc). This tool gives us the chance to play around with these values and makes life just a bit easier:
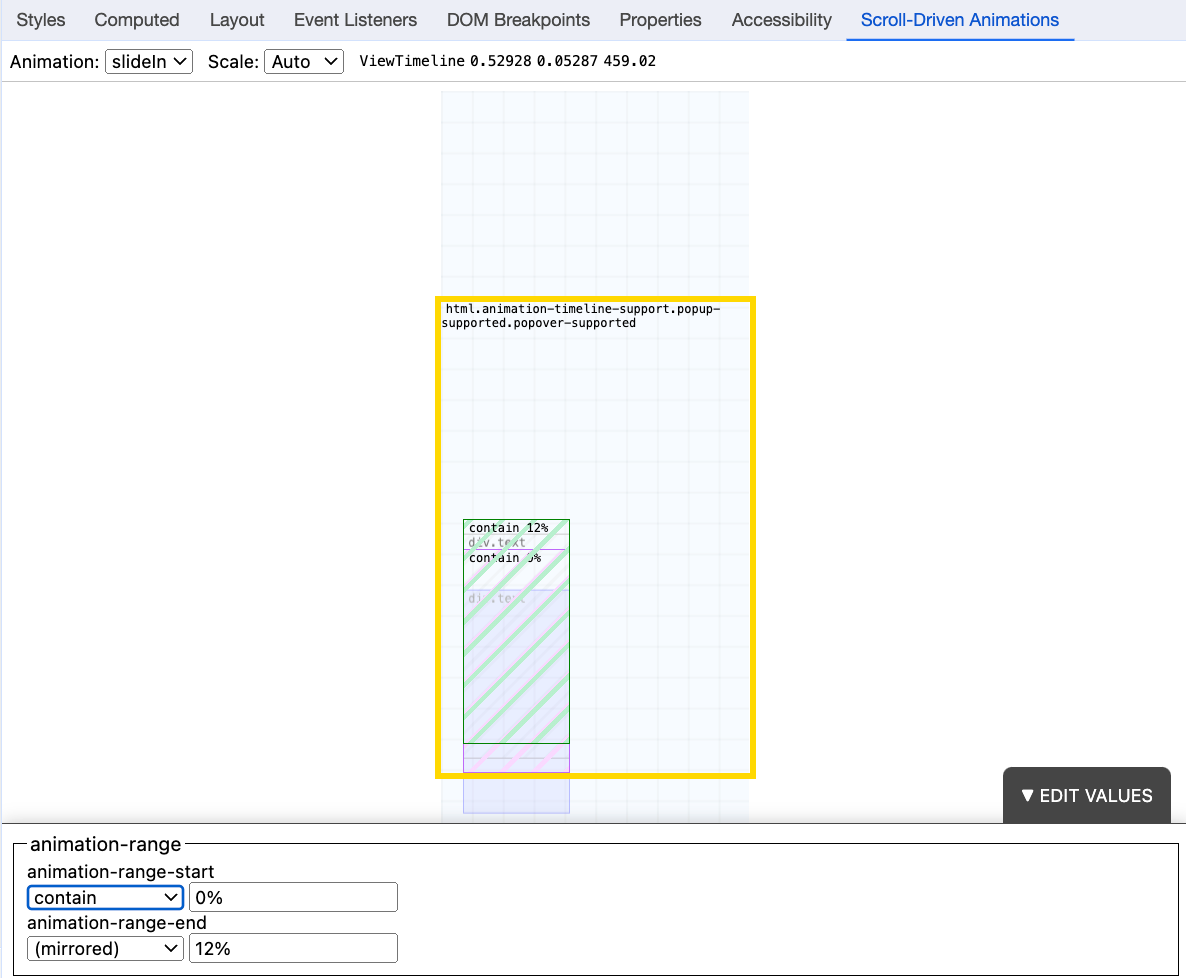
For more ins and outs on how this tool works, check out the video on the Chrome web store page. One note though, we can not access this tool via iframes, so if we want to test it with a codepen, we have to use debug mode in our pens. You can use this link if you want to do a quick test.
Maybe in the future we can have a native version of this in DevTools, removing some of the restrictions of a plugin.
Conclusion
Most of the things I wrote about here are just about those little ease of life things. Those things that have been updated but might’ve gotten under our radar. These little changes really create a big impact when put together. I’m sure not all of these are little when it comes to developing them, so a big kudos to the DevTools team.
I have a feeling many more things are coming our way for animations (maybe a native DevTools Scroll Driven Animations debugger?). This would make sense because the DevTools Team asked a lot about the animations panel earlier on CSS Day this year and we also have a lot of new animation stuff, not only on scroll, but also view transitions.
So who knows, maybe some cool big animation update in 2024? Let’s see.
Hungry for more DevTools: