A lot of developers use Chrome as their main browser and I'm one of them. There are a few tricks in Chrome DevTools that don't seem to get enough attention. So for this article, I wanted to highlight some of the features that I love and actually use in DevTools, that some of you might not know about.
A bit of a shorter article for this month, because I’ve been pretty busy with creating presentations and writing some articles as a guest writer. Nevertheless, I always wanted to write something about Chrome DevTools features. I try to keep myself from writing articles with clickbait titles such as: “5 tools that…”, “6 amazing …”, but to be honest, this is kind of such an article, sorry about that. Still I hope to give you something here you didn’t know about, or want to revisit. So let the list begin!
I will be using the shortcut cmd+shift+p (or ctrl+shift+p) a lot. This is probably the most important shortcut for DevTools, so you best remember it.
Taking a screenshot from an area, (full) page, or node
This one only recently came to my attention by following Umar Hansa. I’ve been subscribed to his mailing list for quite some time now and really learned a lot from his little DevTools tips in the past. Seems like he started sending those emails again after a break, that’s nice to see.
At iO, when we do a lot of visual changes to a project, it’s nice to add a screenshot of the update inside of a pull request. And I really love the node screenshot capture for this. It’s really easy, but not that many people know about it, so this is how you do that:
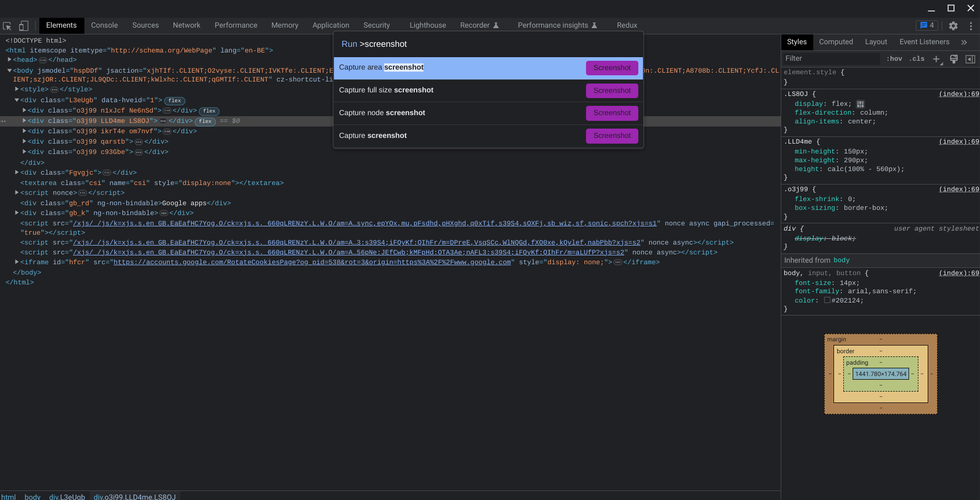
With DevTools open, press cmd+shift+p and start typing “screenshot”, You already see the 4 options here:
- Capture area screenshot: gives you a cursor that allows you to take a screenshot of a selected area.
- Capture full size screenshot: Take a screenshot of the complete page (full width / height
- Capture node screenshot: Take a screenshot of the selected node you have selected in DevTools
- Capture screenshot: Take a screenshot of the window
The node option really gives you such a clean screenshot in cases you want to share something with others about a specific element on the page.
The rendering drawer and toggling preferences
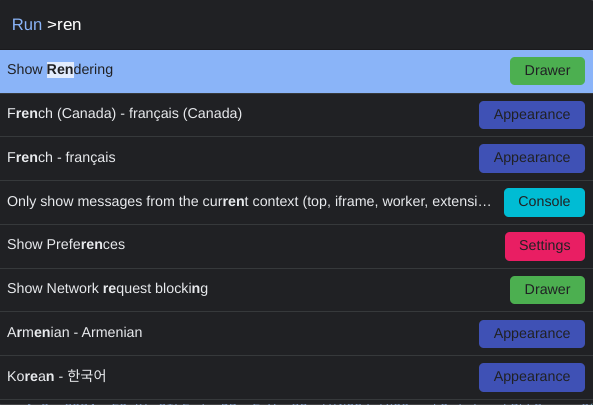
Chances are that the rendering drawer is not yet visible on your DevTools. You can get it easily by pressing cmd+shift+p and start typing “rendering”. Select the first hit, this should open the drawer:
There are a lot of things in the rendering drawer that come in handy for debugging or optimizing your project. I won’t be going in-depth for all of the items here as this drawer could be an article by itself, but let me highlight some of the basics:
Detection of potential rendering issues
The rendering drawer is divided in some sections with a border and the first part is handy for debugging. The ones that I like to use here are the first three (convenient):
- Paint flashing to highlight the repaints
- Layout shift regions in case layout shifts are detected
- Layer borders can be handy as well when debugging those z-indexes
I haven’t really used the others a lot, but I do think they can be handy depending on the kind of work you do. I think there was a case where I could’ve used the “disable local fonts” feature in the past. There was a case where the client got some bad version of the font, but I didn’t know about this drawer then. But if it ever happens again, I’m glad to know I have something like this in the toolbox.
Emulate media features
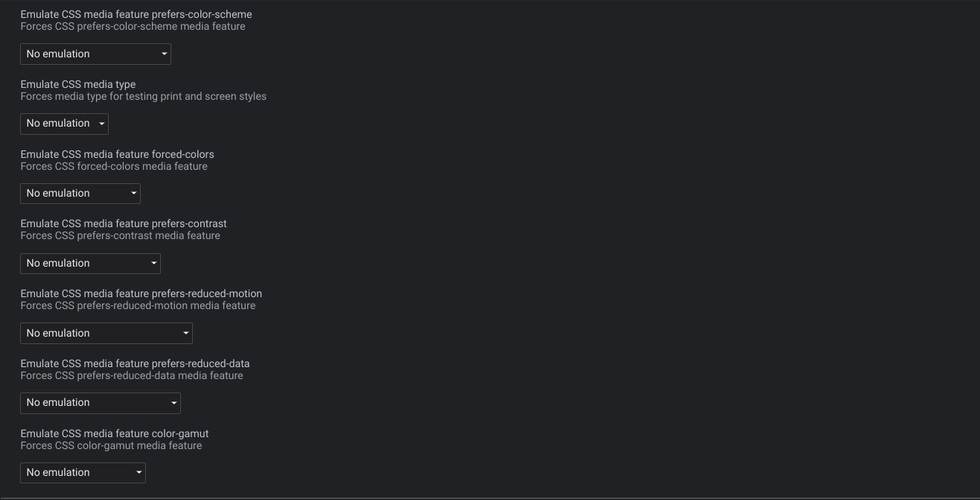
This is the part of the rendering drawer that I use the most. It has some options to switch between user preferences such as light and dark mode, reduced motion and prefers-contrast. There is already an option to check for the reduced-data media feature, although there isn’t much support for it yet, something I think I’ll use a lot more in the future. There also seems to be a new one which forces the color-gamut that I have yet to play around with.
The benefit of this, is that the options stay active even while reloading the page.
It’s nice and easy to toggle these media features while optimizing your project for accessibility and I really suggest people taking a look at these features.
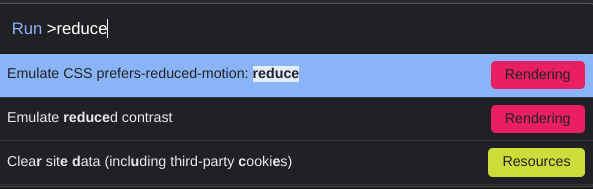
Bonus tip: Once you know the options available here you can use cmd+shift+p and start typing the rendering feature you want for easy access. I often just type in “reduce” to toggle the motion setting when creating animations.
Checking for visual deficiencies and disable image formats
There is an option to check for visual deficiencies which will “re-color” your project. There are so many types of small deficiencies, sometimes it’s nice to know if a certain type of color blindness could really mess up the experience. Haven’t used it a lot yet (mostly because I don’t design most of the projects I create), but it’s nice to have it when needed.
The last two options in this drawer are to disable the AVIF and WebP image format. If there are some problems because of the lack of next-gen image format support, you don’t have to leave Chrome at all and just toggle this setting.
The color picker
This little panel you have when clicking a color inside of your styles inspector has so many options. I’m still finding new ones from time to time. This is so much more than a single color picker. Here is what it looks like:
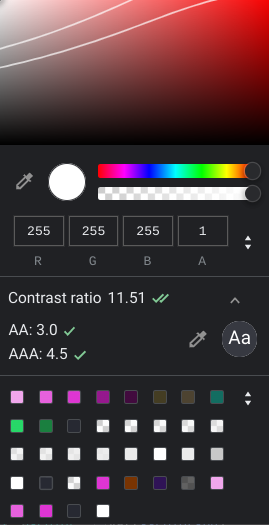
You can really fine-tune your contrast as it gives you some hinting on which color you need to get the best contrast. It even shows some lines inside the color picker to show you where those potential contrast improvements are. I wrote an article about this at the start of this year for Smashing Magazine: Creating A High-Contrast Design System With CSS And Custom Properties if you want to learn more about working with this panel for contrast.
Color variables and Color formats
If you use custom properties for your colors (which, in my humble opinion, you should) You can easily replace your colors with already defined custom properties inside of the inspector. In the swatches you see at the bottom, you can click the double arrows and select css-variables. This will provide you with swatches based on your custom properties and it will actually enter that variable when you select the swatch, pretty neat if you ask me! You can also filter on some other swatches including colors that were found by the devtools on your project in general.
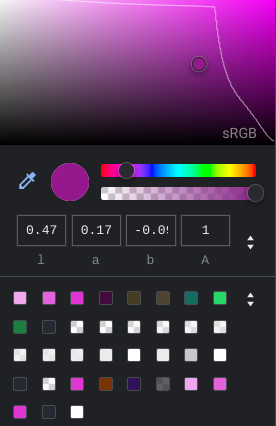
With the new color formats entering CSS you also get some great visual hinting when selecting an HD format. For example when selecting LAB, you get to see which colors fall out of the sRGB spectrum and benefit from the HD color gamut. Aside from a few little personal demo’s, I still need to take a deeper dive into these new color formats, but it’s nice to know that DevTools can help me with this.
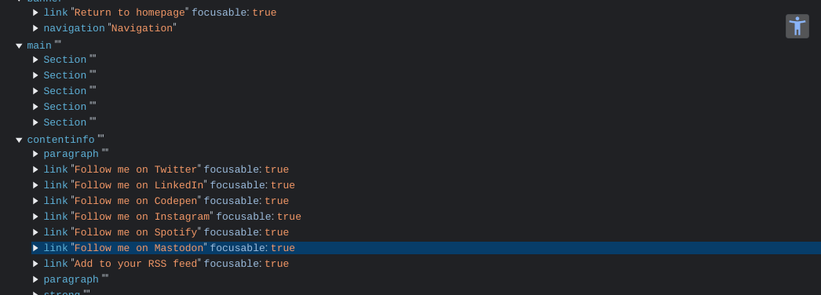
A full page accessibility tree in DevTools
This feature is still experimental for the moment. But it’s one that I’ve enabled as it can give me a nice overview of my landmarks and general structure for screen readers. I still believe that great testing involves actually using a screen reader and a person who actually uses them, but aside from that, this is a great starting point.
To enable this, go to “accessibility” inside of the elements panel (or use cmd+shift+p and type accessibility) and enable the little checkbox “Enable full-page accessibility tree”. You will have to reload DevTools after that.
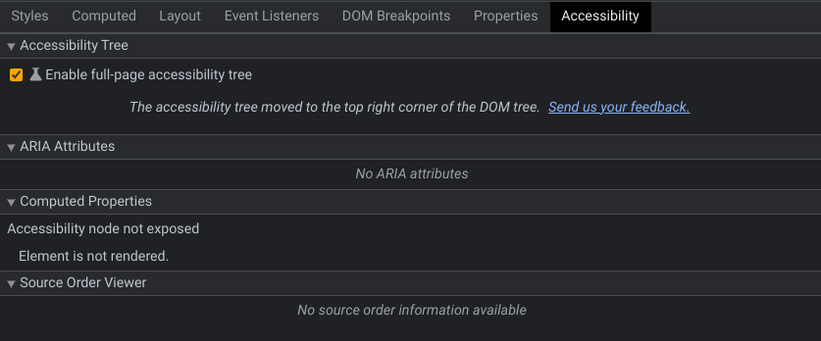
When enabled, you get a little accessibility Icon in the top right corner of your elements which you can toggle to see the full-page accessibility tree. I don’t consider myself an accessibility expert, but I do my best and keep learning so this can help a lot.
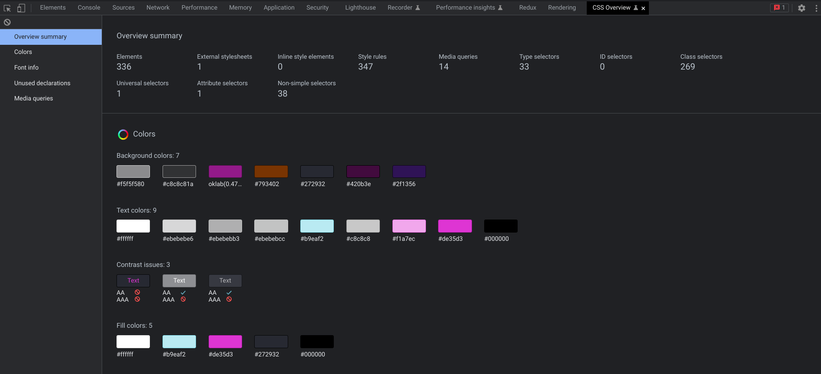
CSS overview
Press cmd+shift+p and type in “CSS overview”. This is quite a handy panel to go to to see some information at first glance. It’s a great tool to spot potential contrast issues inside of the colors tab, find font information or even spot unused declarations. This is great in cases where you want to optimize your CSS as well by reducing the amount of media queries. I love sniffing around in that panel when I visit certain websites as well… I know, that might be a bit too geeky. I also have some things for my own website here that I really want to take care of that seems to get moved to my personal backlog all the time.
DevTools has so much more that I don’t know about
I really discover something new in DevTools at least monthly because it gets developed so actively. For example, I recently saw Bramus tweeting a specificity feature that is in the works. We use this in our toolkit on a daily basis and it has so much to offer. It’s a personal goal to become a bit more of a “power user”. If you want to learn more, I’d like to end this article with some of the places I frequently find new information on the subject:
- Umar Hansa email tips
- Google DevTools Blog
- Google Chrome Developers YouTube channel
- The CSS podcast has some great featured episodes on DevTools as well with Jecelyn as a guest.
Note: the CSS podcast link is for Spotify, but you can find some episodes on YouTube as well. I think I heard every episode in my car… That way people don’t bust me laughing out loud with some of the (maybe too) geeky jokes on the show.