It's the end of November, holidays are getting closer, and I thought, why not make a list? In this article, I want to highlight a few CSS debugging features I'd love to see in Chrome DevTools in the upcoming year, some of which are new and others that are long overdue.
I’m not going to make this a long article, but I want you to know, that I could easily come up with more features… However, these are the ones that I really could’ve used a couple of times. And who knows, maybe some of these are features already exist, and and someone will point that out for me 🙂.
1. More positioning debugging.
For this, I’m going to split it into two; one of them is a more recent capability that we will start with, and the other is long overdue:
Anchoring
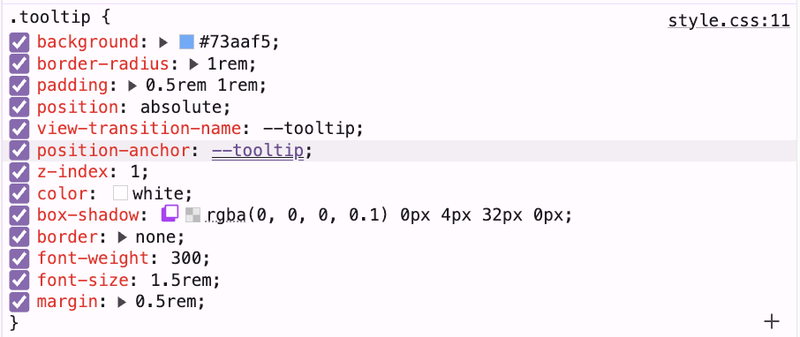
Especially with anchoring being in Interop this year, I was hoping for some better anchoring tools. We already get a link from the positioned item to the anchor, but I kind of feel I need a bit more from time to time:
- I want to see which position-try fallback is currently active
- I want to see an icon next to the position property, indicating that the element is anchored; It might be handy to know at a glance.
General positioning
I always felt that we could get some more info for the positioned element.
For example
- When I use position: absolute; within a relative container, it would be nice to get some sort of quick view to see on which container it is positioning itself to, as in some cases, the stack can get complicated.
- It would also be nice if I could see a distance measurement on my website for that item (this also counts for anchoring).
2. Hide overruled styles with a simple toggle
When we only want to see the applied styles, we can look at the computed tab, we can even use the computed tab to jump back to the styles panel.
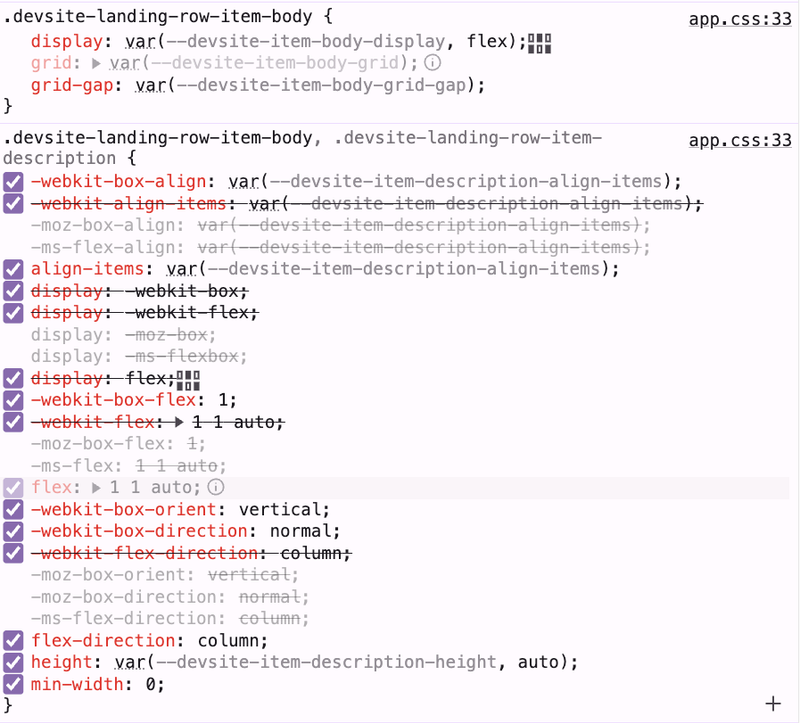
However, there have been multiple occasions when some property is being set, and I quickly want to know which class it came from. Not every codebase is equally clean, and sometimes there are a whole bunch of styles that have been overwritten by specificity.
I just want a quick toggle in my CSS panel to hide the crossed-out styles so that I can get a quick browse. Seems like an easy feature.
3. Guides, rulers, and more quick looks on my webpage
I’m just going to say it like it is. I want a LOT of features from VisBug baked into Chrome DevTools, especially the rulers, editing text, and quick overviews.
We see these things all the time in design tools, and it’s such a shame that we don’t have them by default in our “website debugging tool”.
I feel like this is such a missed opportunity to just have that baked in. While we’re at it, let’s also add some top and left rulers where we can draw lines out of, just as you would in a design tool.
This is a small bit of text for a huge feature, but I believe this is really needed!
Simply put: learn from VisBug.

4. Sticky panels
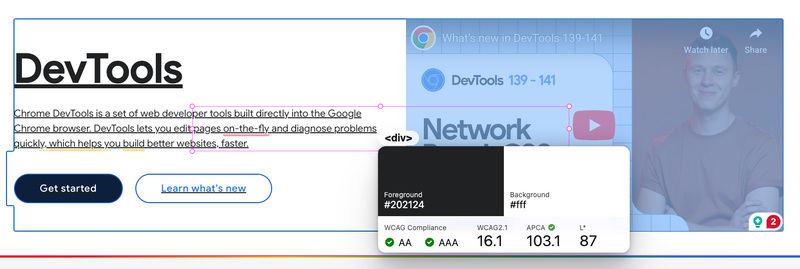
I’m going to refer to VisBug again, and I’m not sure if it’s a feature or a bug. But what I like is that when you have a panel, inspecting contrast, it gets stuck when you click.
We have soooo many panels in DevTools: colors, shadows, easing, …
Wouldn’t it be cool to just grab them and place them on your page?
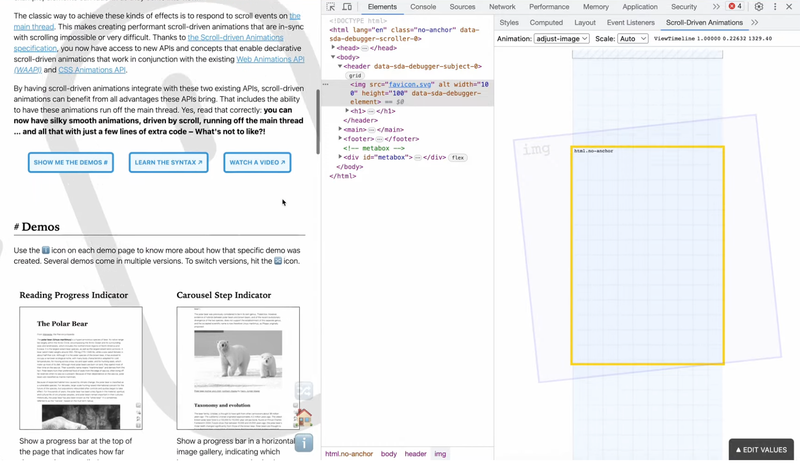
5. Scroll-stuff animations panel
There is a lot of scrolling going on in CSS nowadays, from carousels, scroll-state queries, to scroll-driven animations. There is a scroll-driven animations debugger for DevTools, but even tho it is made by a Googler, it’s not a real DevTools feature.
So, can we have this in DevTools by default?
Can we add this? And maybe extend it for carousels, snaps, etc…
Who knows, I think we need this.
Bonus: Fast features and a clear focus shift towards AI
With new features coming to Chromium, I’m sometimes bummed out that the tooling is not ready yet. For example, I don’t see any pseudo-elements of the customizable select, I don’t see ::details-content, but then again, I do see pseudo-elements for carousels, it feels a bit messy, or is it just me? Sometimes I feel like the tooling should be part of the “this is stable” story, but then again, this could be a “shortage of developers” thing. I dunno, just putting that out there.
I know recent DevTools updates had a lot to do with AI features. And that’s ok, I understand it, but I feel that there is so much handy stuff that can be done here.
Sometimes I want to design in the browser, and who knows, maybe in the future, I want to ask Gemini to move this item by x pixels, so taking that quick look at current values might help as well.
This is just one developer’s opinion, but let’s not forget all the cool stuff to be done in favor of prompting mechanisms.
I welcome new AI features, but want my DevTools to be my actual toolbox, not my assistant.
Call me a geezer, but when opening DevTools, it kinda should still feel like I’m running towards my garage, get my trusty toolbox, and pick the right tool for the job, and just tinker away.
So these are just a few of those features that came to mind, and I’m sure I can think of many more, but I’m more curious to see what you would like? What is something you missed in DevTools?

